Categories
New

Things 112: Eyes, Guessing Cat, Amigara Fault

This week Things has a very slight Hallowe’en theme.

Puzzle
This is one where you should gather some people around the monitor and see who can do best: guess the cartoon (or CG) character from their eyes (mouse over the eyes to see the character outline that should tell you if you’re right).

And yes, it is pretty difficult – I only got 6, and I watch a lot of animation!

Video
Here’s a video that begs the question: is the cat playing the game, or just acting out of blind instinct?

http://www.youtube.com/watch?v=QrlTijuhVOA

To which the answer is to have a big argument about the definitions being used before concluding that you can’t tell.

Quote
In the wonderfully stylised animation The Secret of Kells, I heard the line “One beetle recognises another” and wondered if it was some kind of proverb. It turns out that it is, and actually – obviously – there are a whole bunch of Irish Proverbs, which in translated form become alternately profound, banal or hilarious, just as I imagine English proverbs must seem if you haven’t grown up with them. Here’s a list of them on Wikiquote, and here are a few of my favourites, for unstated reasons:

“Every beginning is weak.”

“Time is a good story teller.”

“A lamb becomes a sheep with distance…”

“The quiet are guilty”

Comic
The Enigma of Amigara Fault is a horror comic that impressed me with its unconventional approach. It’s 32 pages, and originally in Japanese so you have to read the panels right to left. But if you want a comic that will freak you out for Hallowe’en, it’s worth it. Unless you’re particularly claustrophobic, in which case you should probably steer clear of it entirely.

Answer – Malady X
In Things 111 I asked what the probability of having Malady X is if a randomly administered 99%-accurate test for it comes back positive. As Phil and Thomas noted, you can’t actually answer from this information alone: you also have to know what the probability of a random person actually having Malady X is. A lot of people don’t have an intuition for this fact. I’m going to attempt to explain ways to apprehend that hand-wavingly, mathematically, and visually.

Argument from hand waving and examples:
Imagine the probability of having Malady X is 0% – nobody has it. In this case, it’s certain that getting a positive result means you were simply in the 1% of cases where the test comes back incorrect.
Conversely if the probability of having it is 100% – everybody has it – then you must be in the 99% of cases where it is accurate. In this way, it’s clear the underlying probability influences the chances that the test is correct!

We might worry that these extremes somehow break the puzzle, so let’s imagine less extreme alternatives. Imagine 1,000 people are tested. If 50% (500) really have Malady X, on average we expect the test to come back positive for 99% of them (495) and also for 1% of the 500 that don’t have it (5). In this situation, 495 out of the 500 people for whom the test was positive actually have the disease – 99%.

Alternatively, if 1 person (or 0.1%) out of the 1,000 has the disease, they’re very likely to be correctly diagnosed, and we expect roughly 10 of the other 999 to get a positive result. In this case 1 out of 11 people with a positive result actually have Malady X – fewer than 10%. So clearly the underlying incidence level matters.

Argument from maths:
There are two probabilities at work: the chance the test is correct (99%) and the chance of anyone having Malady X (unknown – let’s call it X%). When you combine probabilities you multiply them, so for example the chance of anyone actually having Malady X AND getting a postive result is 99% times X%.

If someone gets a positive result and that’s all we know, we reason as follows:
A = Probability someone has Malady X and tests positive = X% times 99% times
B = Probability someone does not have Malady X but still tests positive = (100% – X%) times 1%
If you test positive, the chance you actually have it is C = A / (A+B). But if you haven’t studied probability carefully, I’m not sure you could infer this, which is why I like to come up with other ways of getting a feel for the correct answer.

Argument from visualisation:
Since there are two probabilities in question, and we combine probabilities by multiplying, this naturally suggests a visualisation where probability is represented by rectangular area (since area is calculated by multiplying height by breadth).

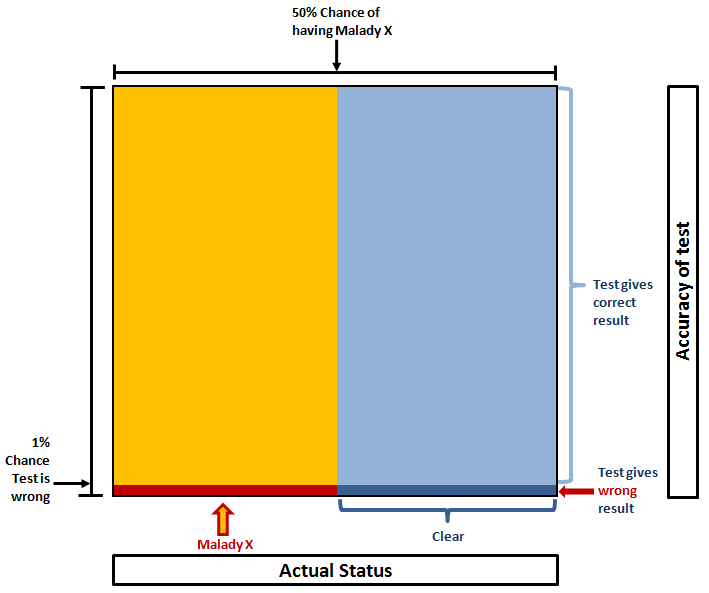
For example, if we imagine the actual incidence rate of Malady X is 50%, the picture would look like this (click for big):

If the test result is positive, you either have it and the result is correct (big yellow area) or you don’t have it but the test was incorrect (small dark blue area). The chance of you actually having Malady X is equal to the proportion of those combined areas that is yellow. In this case:
Yellow = 99% x 50% = 49.5%
Dark blue = 1% * 50% = 0.5%
Probability you have it = Proportion that is yellow = 49.5% / (49.5% + 0.5%) = 99%.

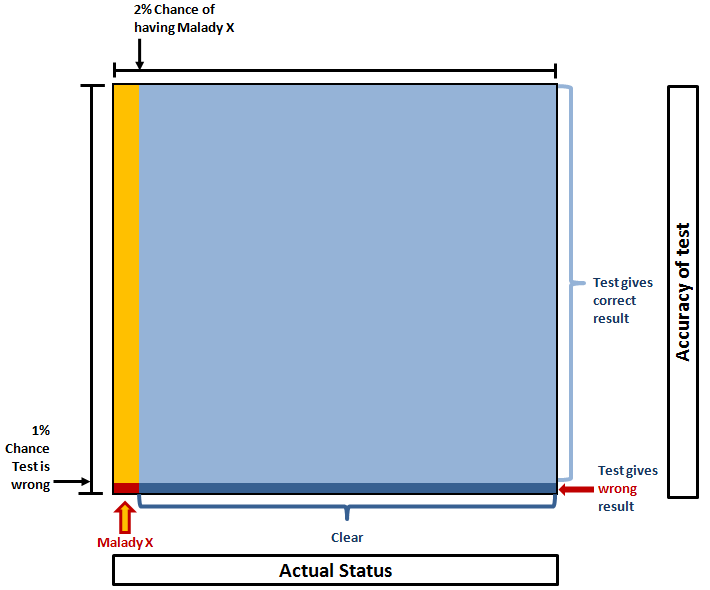
Alternatively if the incidence rate is, say, 2%, it looks like this:

Here we see the yellow and dark blue areas are very similar, so the chance of you being one or the other is much more even. In fact, it’s:
Yellow = 99% x 2% = 1.98%
Dark blue = 1% x 98% = 0.98%
Probability you have it = Proportion that is yellow = 1.98% / (1.98% + 0.98%) = 67% (ish).

As Peter Donnelly shows in this TED talk, this actually has some severe ramifications, because when the probability of the thing being tested for is extremely low, it becomes overwhelmingly likely that a positive result is false, but people intuitively feel that a 99% accurate test should be correct 99% of the time.

Thomas also noted:

If anyone is interested in playing around with the probabilities (even if you’re not familiar with the maths), I recommend GeNIe:
http://genie.sis.pitt.edu/
It lets you create networks of dependencies, set evidence and work out probabilities in problems just like these.

-Transmission finally ends
Categories
New

Things 111: Malady X, Stretching Cat, 3 Panels

Question
(Thanks to Simon for reminding me of this important probability lesson!)

At random, you are tested for Malady X. Alarmingly (particularly given that you don’t even know what Malady X is) the test comes back positive. But you know these tests are not always perfect – there’s a chance that it’s wrong, and you don’t really have Malady X at all. So you ask how accurate the test is. You are told that if someone really does have Malady X, there’s a 99% chance the test will come back positive; for someone that doesn’t have it, there is a 99% chance the test will come back negative.

What is the probability that you actually have Malady X?

Animated Gif
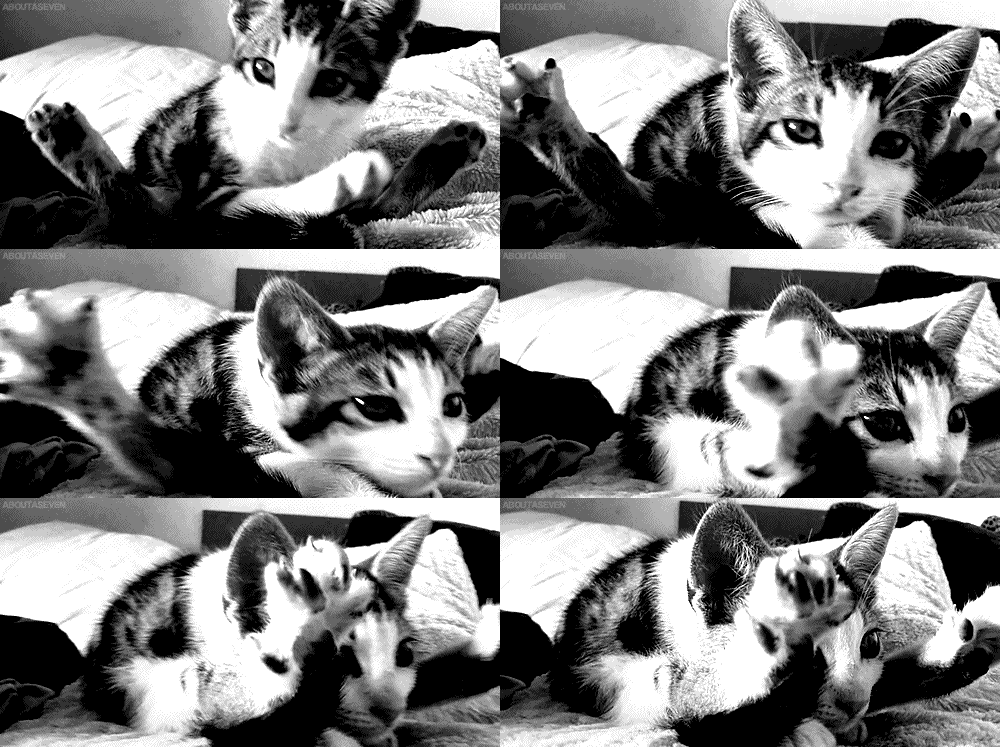
Here is the best animated gif of a cat I have seen in a long time:

Link
(via Silv3r): A huge and (I think?) growing collection of street fliers that play with the form, some okay and others quite, quite brilliant, can be found here (browse the other pages if you like what you see).

Picture
I am proud to be able to say that I know James White, the author of this perfect 3-panel comic, personally.

Answer
Last time I asked about what people really mean when they claim “change is accelerating”.

The most direct and plausible answer came from John B, who suggested that the scope of human knowledge is the thing that is really growing, and the subjective change we experience is what arises from these discoveries. While it’s only a proxy, one way to measure this is to track how many patents are granted over time, and on a logarithmic scale this does look kind of linear (indicating acceleration).

Bex has an alternative view. The perception of change seems to generally accelerate with age (which in itself is already enough to explain why people claim this all the time). The population of the UK (at least) is ageing. Therefore, the speed-of-change will be reported to be, on average, faster over time. Sneaky!

As the Wikipedia article on the subject currently notes, another confounding factor could be the growth of the human race itself. For example, if a fixed proportion of humans files patents, exponential growth in human race will directly lead to exponential growth in patents filed.

In any field, taking any trend and extrapolating it arbitrarily far into the future is generally unwise. If we don’t know exactly what we’re measuring, and we don’t understand the factors governing the change, even less so. Given the potential disruptions of the technology we’re seeing already, if anything it seems just as likely to me that sudden power imbalances become more likely, which could lead to large swathes of humanity being wiped out, or global human society turning into a dead-end all-powerful dictatorship with no desire to change the status quo.

Categories
Old

Things 51: Beatles Rock Band, Google Squared, Ingenious Comics

(Originally sent June 2009)

Things now returns after a brief hiatus during which I revised for and took my IDM Diploma exams. They seemed to go okay.

Movies
I saw Terminator Salvation, which I can’t particularly recommend, and Blue Velvet (on DVD), which I can.

Video
The intro to the Beatles specific Rock Band game is a wonderfully conceived and animated potted history of the band.

High quality video on the dedicated site:

http://www.thebeatlesrockband.com/cinematic.php

YouTube quality if your PC isn’t up to it:

Link Google Squared is like Google’s approach to what Wolfram Alpha does. For example, if you search for planets, it tries to understand what you are looking for and what useful things you might like to know about instances of that thing, using Google algorithmic magic.

When Wolfram Alpha has an answer, it’s right – when it doesn’t have an answer, it has nothing. Google Squared lives in the fuzzy space in between.

As a side effect, this means you can use Google Squared as a kind of I-Ching / astrology / random fortune generator.

Try the following:

1) Go here http://www.google.com/squared/
2) Put in your surname
3) If you get results, use ‘add items’ at the bottom to add the first names of your family – if you don’t get any results you will be given some blank fields in which you can enter the first names directly
4) In the top right you can add additional columns. Type in ‘awards’ and press ‘add’
5) Find out how much your family members have won according to the Google Squared lottery!

Personally I was found to have won HK$0.00, whereas my mum got $517,115.00.

You can see what it thinks about you in other ways – for example, add a column titled ‘orbital period’. Turns out my sister has an orbital period of 1,975.4045670 days!

Quote
‘Newsarse’ [Now NewsThump – T.M. 1/7/11] is like a less polished, UK version of The Onion, providing a satirical take on current events from a UK perspective.

I quite liked their take on YouTube comments:

YouTube’s spokesman states “we are pleased to offer not only graphic images of canine dismemberment, but also a platform for viewers’ irrelevant comments and violent outbursts of racism.”

Pictures
In the past couple of weeks I saw two fascinating ways of doing something different with comics.

Choose-your-own-adventure comic based on reading speed:

http://www.qwantz.com/index.php?comic=1486

One character going left to right, one top to bottom:

http://eruditebaboon.livejournal.com/17849.html

This week’s puzzle – paper
Why do people generally prefer to read writing on paper than on a screen?

Last puzzle – buttons
The puzzle regarding why buttons do up the way they do (one way for male and the other for female) is a difficult one, since answers cannot be proved, and as such it is all too easy to come up with one theory and feel the matter to have been resolved.

Here’s how I broke it down in reply to some suggestions on the CC list:

There are actually two questions bundled up – why is buttoning consistent, and why is it the way it is for the two genders.

Assumptions:
– Buttoning requires both hands to perform a fairly dextrous action and has no particular handedness bias
– Being familiar with buttoning one way will tend to make clothes that button the other way less desirable
– People will tend to wear clothing items for their gender, not so often clothing of the opposite gender

Under these assumptions, we can expect consistency of buttoning to emerge for each sex (but not necessarily opposite to one another) from random starting conditions, and a slight bias one way or the other at the start is likely to have a strong effect on the final outcome.

Arguments could be made in each direction, as it would only take a small effect to tip things one way or the other.

I found an interesting viewpoint on why it should be the opposite way for males vs females in a seemingly well-informed article on a period costume site.

From the last paragraph:

“Since female clothing took on more and more features of male clothing in order to express emancipation […], it became necessary to establish a feature that signalled that an item of clothing was, despite its male appearance, nevertheless female.”

Categories
Old

Things 36: Amara’s Law, Wondermark, hahahahah

(Originally sent December 2008)

The ‘Things’ email has existed in one form or another for over a year now. The fact that this is number 36 and not 52 shows that I clearly take too many Fridays off. (Actually it was mainly due to a big hiatus). Anyway, I have this Friday off, but have decided that that is not a good enough excuse.

Owing to the popularity of the chicken video last week and the sort-of anniversary of Things and the approaching of Christmas and the addition of more people to the list over the year, I thought it might be an idea to have a ‘Best of Things’ roundup next week.

So please reply and nominate your favourite items that have ever appeared in Things, and I will use these to compile a top 5, or something. I guess the people that just joined in the most recent wave don’t really have enough to go on, sorry! [Note, not a live question, this was sent in December 2008! – T.M. 22/1/11]

Quote
Roy Amara
:

We tend to overestimate the effect of a technology in the short run and underestimate the effect in the long run.”

Link
Wondermark
is a webcomic that is also a really great example of the value of copyright expiry. David Malki takes images from the 1800s (sourced from the public domain or his own collection of rare books), does a bit of photoshop and then adds speech bubbles.

He’s actually not bad at drawing either, but his writing is really very good, and this enables him to focus on that.

My personal favourite strip is a great example of how he makes humour out of philosophy:
http://wondermark.com/413/

My favourite sequence consists of four strips about getting rich, or not, which begins here:
http://wondermark.com/383/

A good example of his skill as a writer can be found in the following strip, in which there is a well-argued, thoughtful and erudite argument against the advertising for Shrek the Third, in about 60 words:
http://wondermark.com/298/

Puzzle
Last week we wondered why a chicken holds it’s head so still. A bit of Googling didn’t prove it immediately, but I am pretty confident that the reason is this: their vision, or processing of vision, is either movement-based or strongly prioritises movement. A bit like the dinosaurs in Jurassic Park.

This week a bit of estimation for you. In the UK, are there more households with dogs, or more with cats?

A Video (or two)
This video was brought to my attention by Richard. Alan Watts was a dude who knew what he was talking about, and said some wise things. The South Park guys did some animations that went with those things. Here is my favourite:

For you cat/Roomba fans, here’s another video of a cat riding a Roomba – this time the Roomba is behaving normally rather than being remote controlled. It gets a bit repetitive but do skip to the end if you get bored, as Something Happens:

Picture
A shrewd linguistic analysis of laughter:

Not really a picture I suppose, but best expressed as one.